Blog
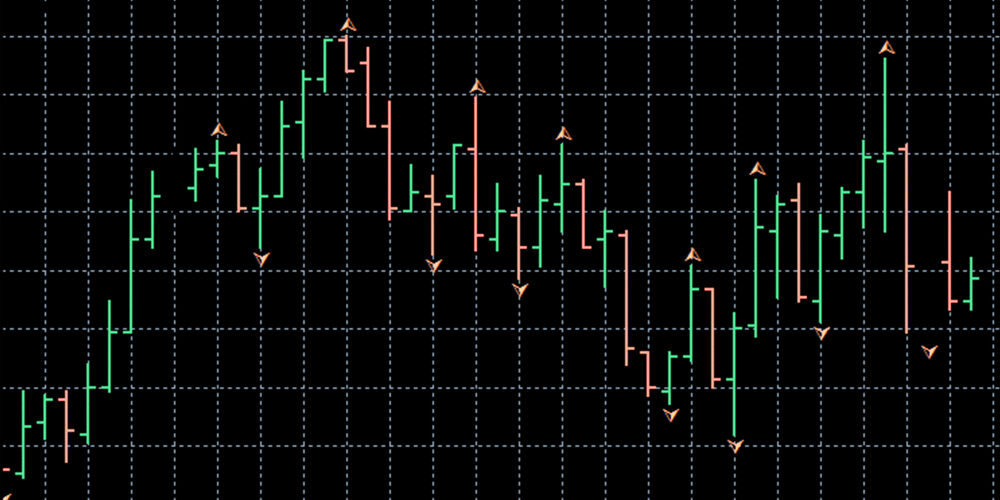
Fractals are one of the indicators used in identifying trend reversals. Namely, fractals represent one of the simplest trade patterns, repeating over time. At least five bars in a bar chart are needed to form a pattern. Fractal can be bearish or resistance, indicating downtrend will be following/ bullish or supportive fractal tells us the price will go up. As a matter of fact, at least two bars are needed to be already in a reversal trend so the fractal could be placed, meaning fractals are lagged indicators.
Highest high with two lower highs from both sides form a bearish fractal placed above the charts with an up arrow. The bullish fractal is placed below the chart, precisely below the lowest low surrounded by two higher lows with an arrow pointing down.
Fractals are more reliable when used in longer time frames and thus more reduced in number. Being lagged is the main disadvantage, however, in combination with other indicators such as Alligator oscillator or Fibonacci retracements is very useful in spotting trading opportunities.
You may want to read this article 👉🏻 Libor


